Segment 2,200+ customers to reframe targeted re-engagement strategies
Role: Data Analyst / UX Researcher

Business Question:
In the MIT Applied AI and Data Science program, I selected my capstone project to work with a fictitious department store company to identify customer segments and their needs and wants for a series of proposed sales campaigns.
Approach
Key Research Questions:
Which model best divides the customer data into groups we can profile?
What are the major characteristics of the different groups?
What can we do to better market to these groups?
My first step was to review the data, check for any gaps and general trends via exploratory data analysis, and get a good sense of the data before doing any modeling.
Goal:
Identify the best model to create customer segments using the given customer dataset. Once we identify the best customer segments, we can prioritize investment in communication and advertising to achieve the highest customer engagement
Exploratory Data Analysis Results:
Data Breakdown

Customer Demographics:
Year of birth
Level of education
Marital status
Number of children and teens in the home
Yearly household income in USD

Customer buying behaviors
# of days since the last purchase
Enrollment date with the company
Number of discount purchases
Catalog Purchases
Store purchases
Web purchases and web visits

Product Purchases
Meat
Fish
Fruits
Sweets
Wine
Gold products

Sales Engagements
Engagement with Company Campaigns
Customer complaints
Data Description
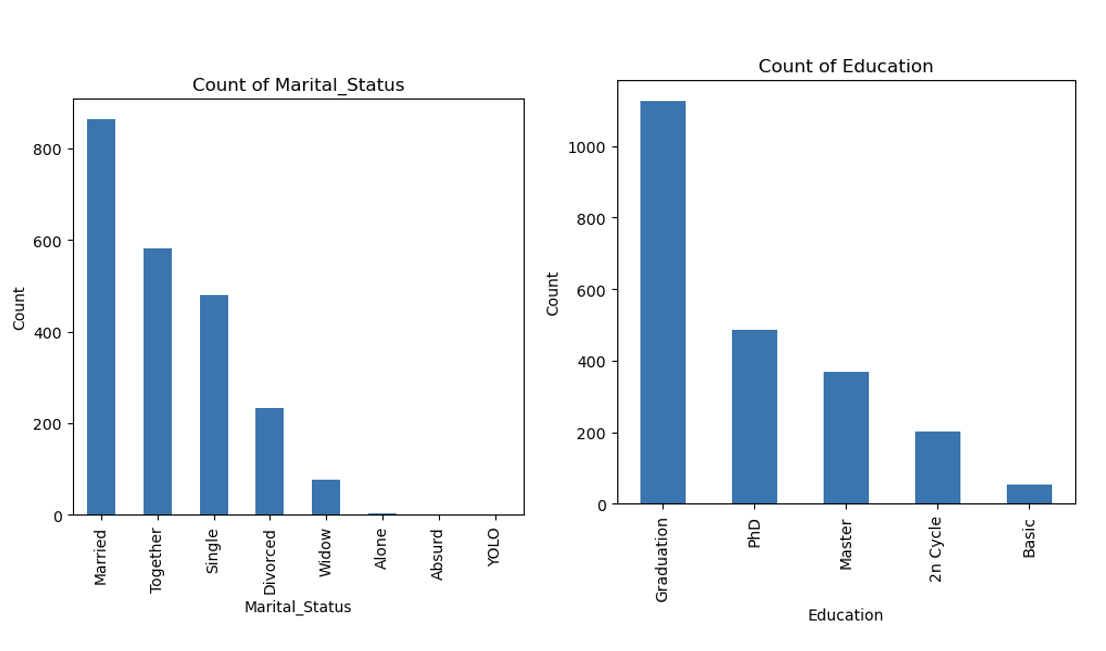
Demographics Trends
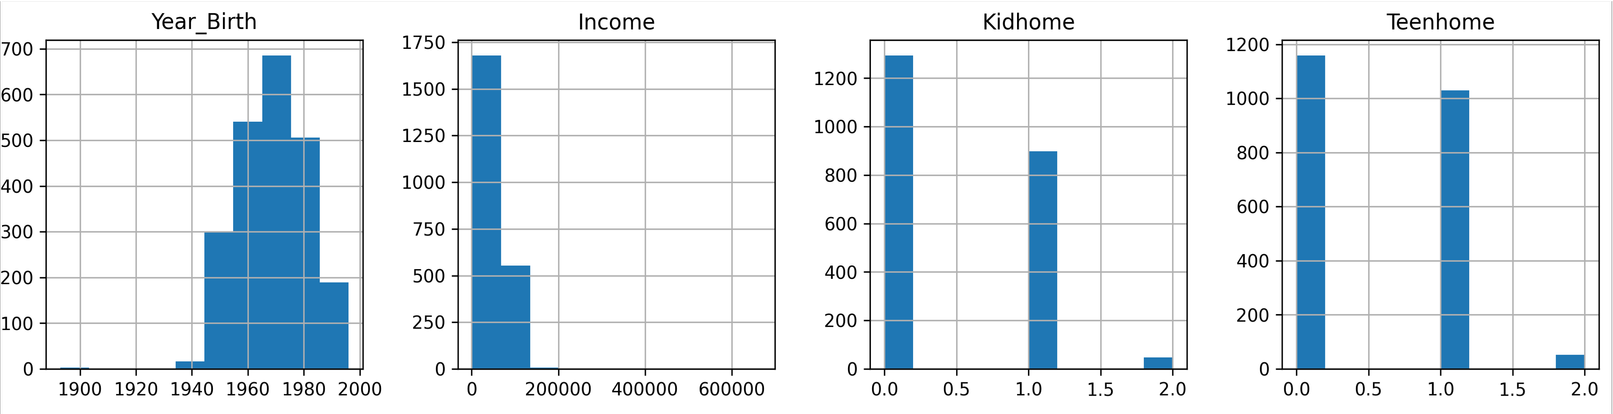
Most of our customers were born in the 1960s and 1970s.
The majority of incomes fall below $100,000.00, though a sizable group has incomes above this.
The majority of customers don’t have children at home, but if they do, it is often one kid or teen.
Buying Behavior Trends
We see a large number of purchases in lower quantities for sweets, fish, and fruits.
But on average, larger quantities are purchased for meats, wines, and gold products.

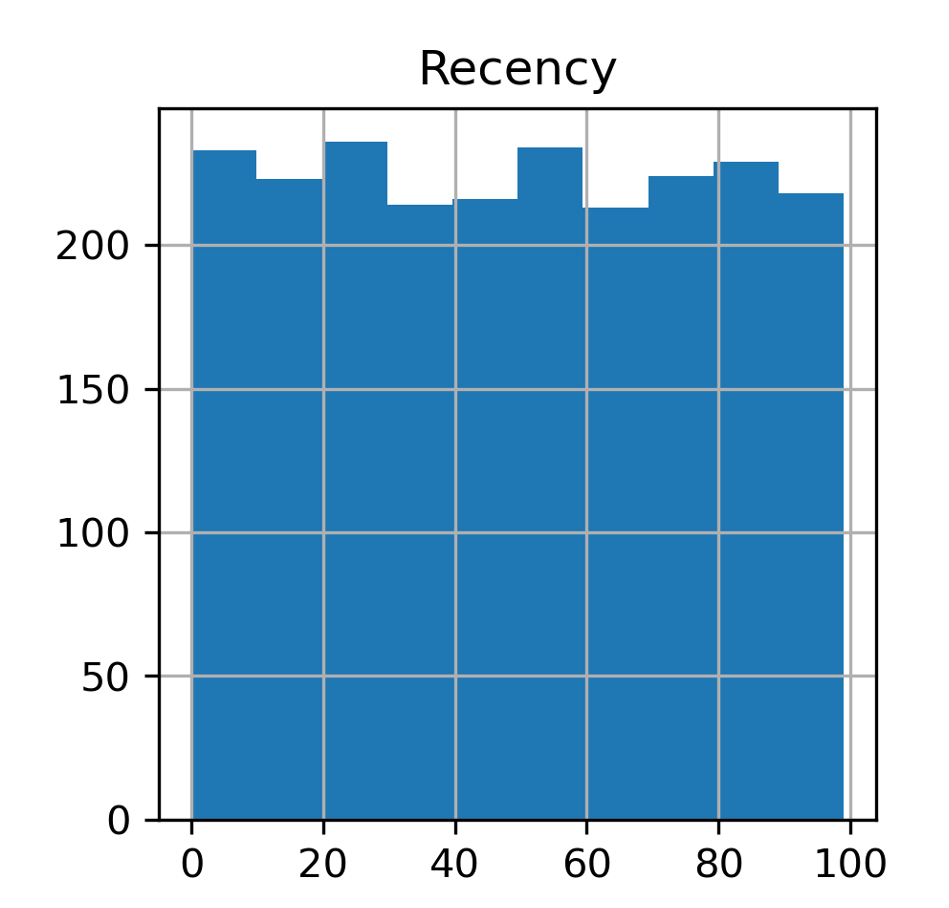
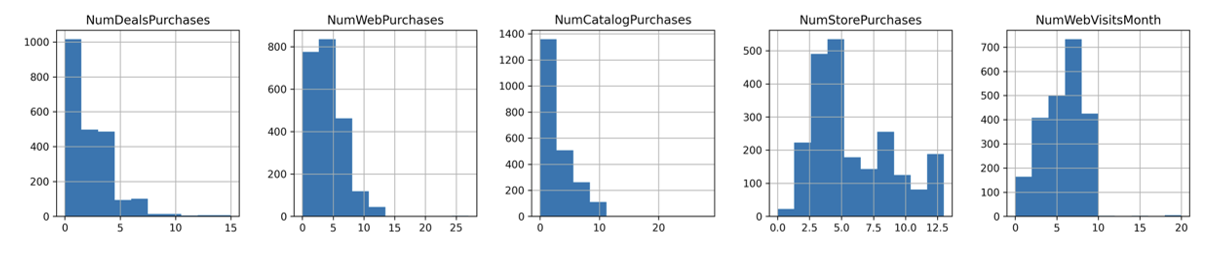
Purchasing Behavior Trends
While there is no trend among our customers regarding their recent purchase date, there is a clearly higher rate of customers shopping in store as their main mode of engagement, with web and catalog purchases next.
With customers making web purchases, we see most visiting the website 5-9 times a month.
Sales Engagement Trends
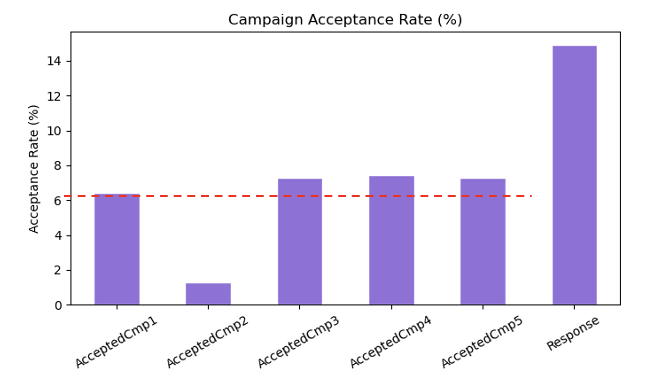
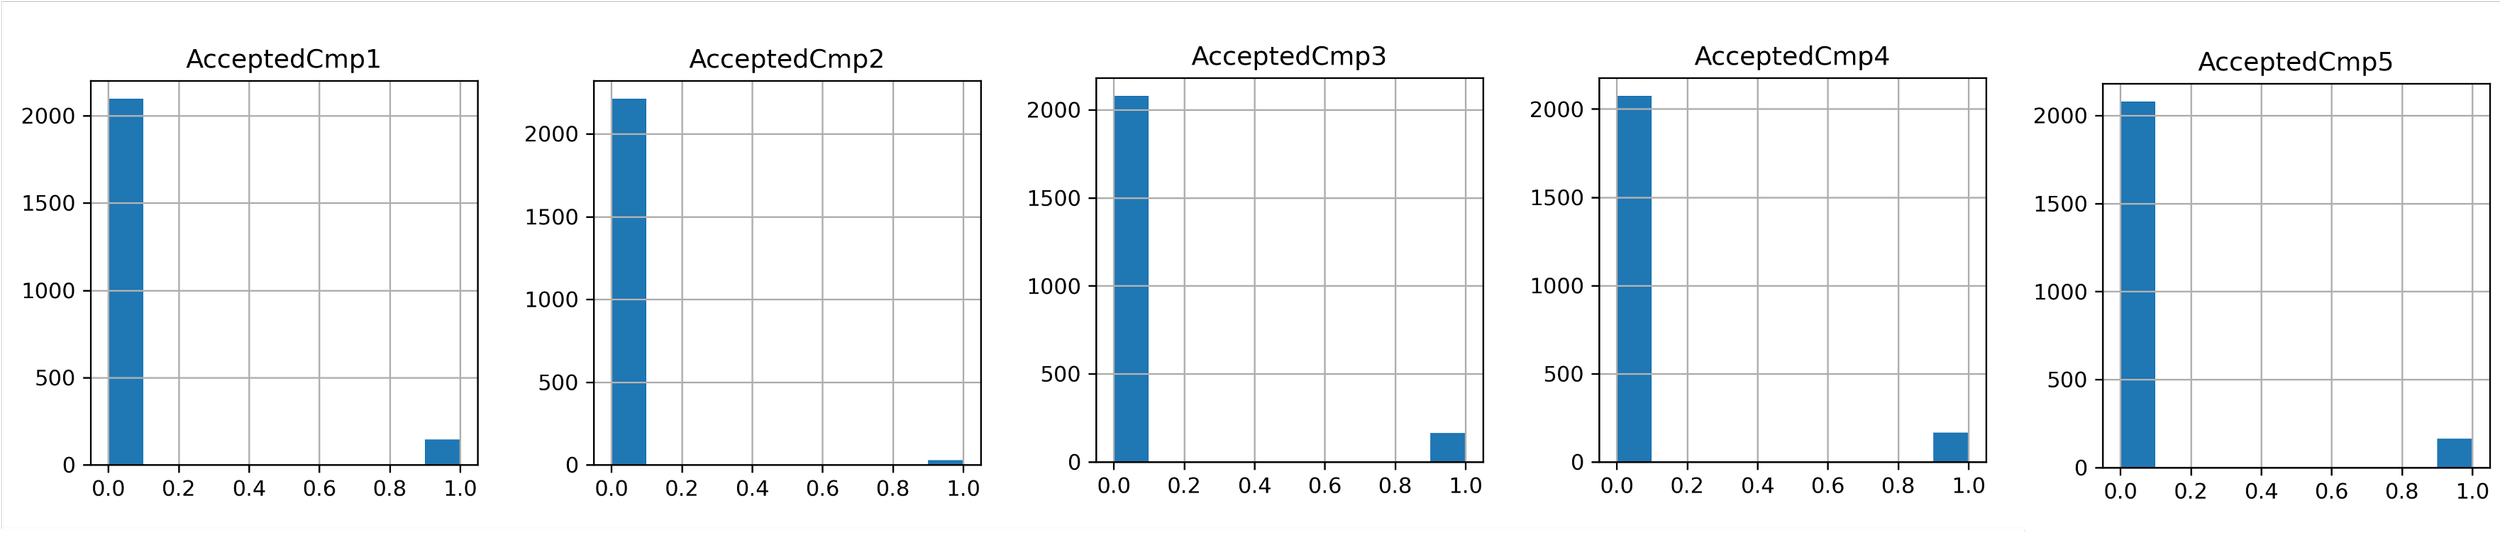
We see that the majority of customers do not engage with our campaign efforts.
But when looking across all campaign sessions, you can see that those who do engage experience a small increase in engagement after campaign engagement #3. We can also see that the average response across all engagements sits at 14% of all users.
Model Selection
Since the goal of the research was to identify customer groups to better target them in the context of a product campaign, and the data provided were customer demographics and engagement, the best machine learning clustering algorithms for this are those that group unlabeled data into clear clusters. This includes models such as K-Means and DBSCAN. I decided to test multiple models to see the performance of each and select the best-performing one, the one that creates the clearest clusters and profiles, to move forward with.
The Solution Formulation
Apply Principal Component Analysis (PCA) to reduce the dataset's dimensionality while retaining most of its variation, making underlying clusters easier to identify.
Then, we compare K-means and K-medoids using visualizations and silhouette scores.
Next, we apply Hierarchical clustering, DBSCAN, and GMM to gain perspectives.
Review models to ensure consistent themes or improve performance.
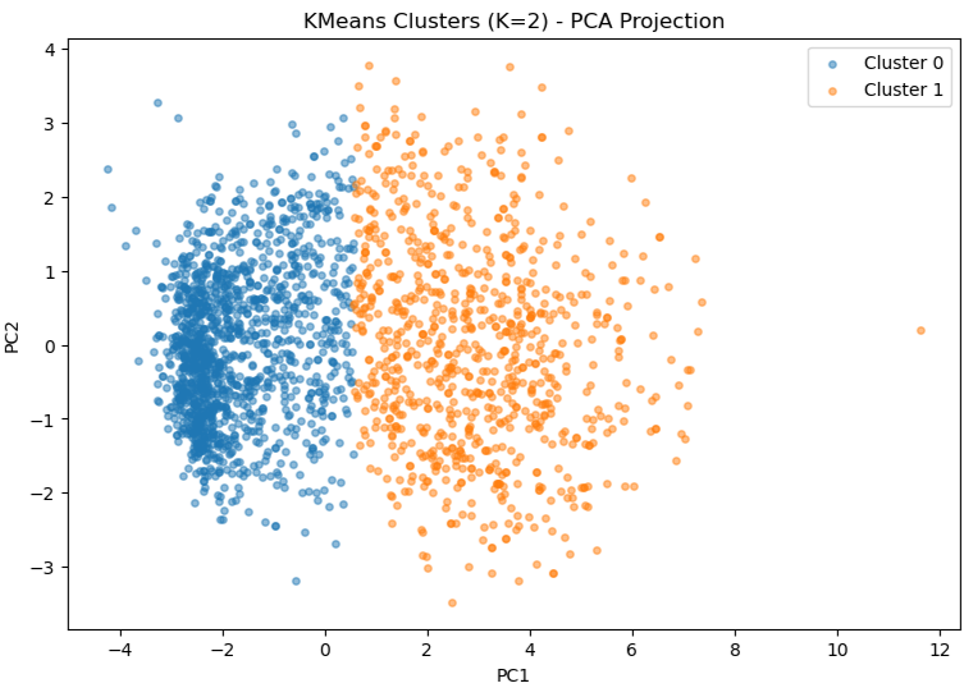
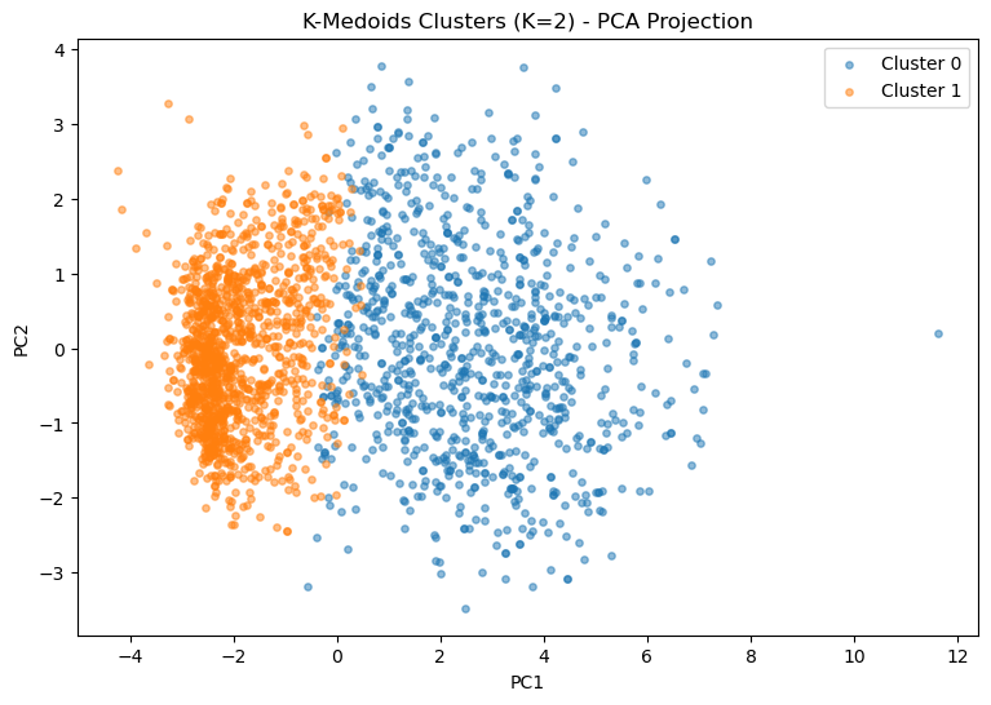
K-Means and K-Medoids both cluster data based on similar features, while K-Means approximates a center for each group. K-Medoids selects a specific point in the dataset to cluster around, avoiding skewing from outlier values that could drastically change the shape or position of the clusters.
Insights:
We can see that K-Means does a better job here of creating separate clusters, while K-Medoids has some overlap.
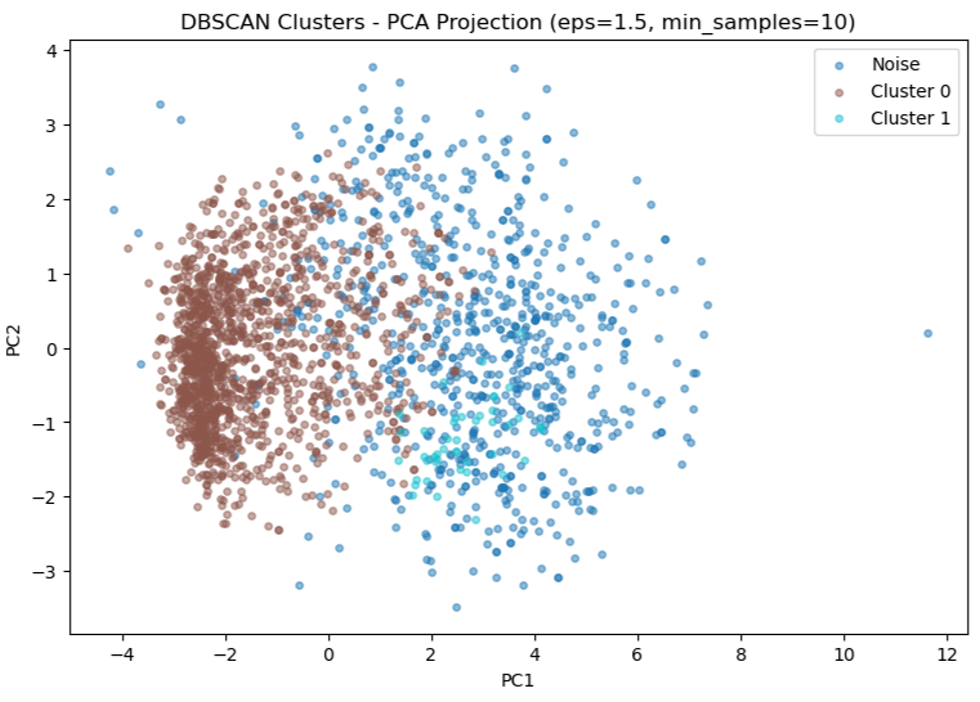
DBSCAN groups data into clusters based on the density of neighbors, allowing for more variation in cluster sizes and avoiding skewing by outliers that K-Means and K-Medoids can struggle with.
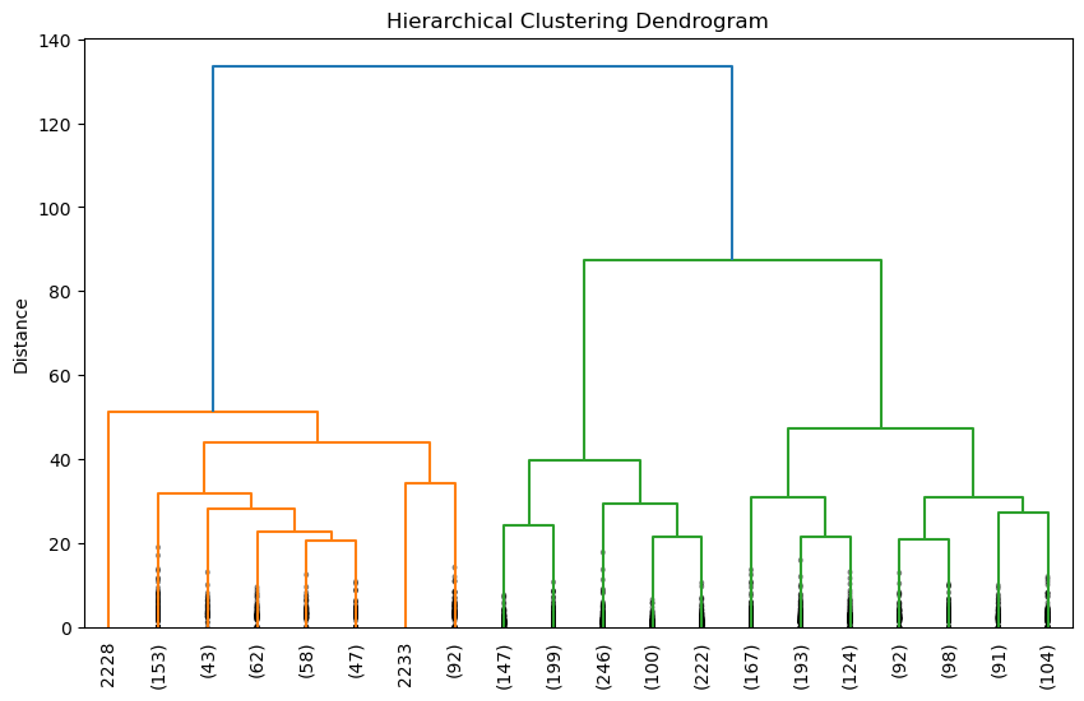
Hierarchical clustering allows me to create a decision tree by grouping the data by different features in the dataset until they can be split into increasingly distinct subgroups. The higher the vertical line, the more stable and reliable the groupings are for understanding the data.
Insights:
The visualizations show that each clustering method separates the data into two primary groups, although DBSCAN and K-Medoids exhibit greater overlap between clusters. Based on the visual separation alone, K-Means and Hierarchical Clustering appear to produce the clearest groupings, making them strong candidates for developing segment profiles.
Rather than relying solely on visual inspection, I also compared the models using silhouette scores. This metric measures how similar data points are to others within the same cluster relative to those in neighboring clusters, providing a quantitative assessment of cluster quality and separation.
Silhouette Scores
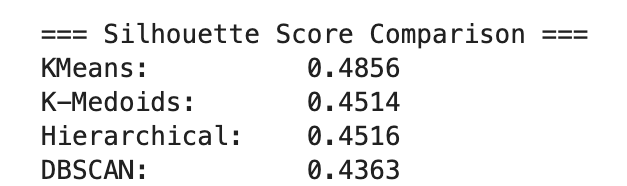
With these scores, I realized that, regardless of the model, they all show significant overlap between groups that may not be readily visible in the charts.
This means the dataset shows shared characteristics between the groups, which I need to be mindful of when creating customer segment profiles and recommendations.
From all these models’ scores, I was confident moving forward with K-Means, as it had a slightly higher Silhouette score while keeping overlap among the groups in mind.
Customer Segmentation Profiles
Budget-Conscious Browsers

Demographic
On average, their household income is around $40,000.00.
They are also more likely to have children at home and do more shopping online.
Buying Behaviors
They are more likely to have engaged recently with the company.
2-3X as likely to engage via the company’s website as compared to other channels.
Product Purchases
They make about half as many purchases across products as the High-Value Engagers.
Sales Engagements
Less likely to actually make purchases, and when they do, they spend less and are more likely not to use discounts. (4X less spend per purchase compared to High-Value Engagers.)
Recommendations
Web Experience optimization
With these customers shopping and spending more time online, we should make sure our products in that space align well within these customers’ price pain point.
Product Specific Marketing
To drive greater engagement, we can tailor discounts and product offerings to better meet the needs of families and multi-person households.
High-Value Engagers

Demographics
They make around $75,000.00 in their household income on average.
They are less likely to have children than our Budget-Conscious Browsers.
Buying Behavior
They make more purchases per day and purchase 2X as many goods as our other group.
While they are more likely to shop in store they are more likely to make purchases across all channels of engagement.
Their spend per purchase is 4 times as large as our Budget-Conscious Browser.
Product Purchases
They are more likely to purchase goods from all categories but higher for meat and wines
Sales Engagement
They are more likely to engage with Campaign efforts at 4 times the rate as our Budget-Conscious Browser.
Recommendations
Campaign Engagements
Make sure we get a large volume of campaigns out to these customers, as they are more likely to engage
In Store Sales
As these customers make more purchases in stores and use discounts, we can make sure to make these discounts ( coupons, sales, etc) visually prominent in the physical store experience
'
Cross Group Recommendations

Campaign engagement during peek seasonal customer engagement periods
Most customers engage with our company during the Spring and Fall seasons. The quicker we engage with them in campaigns the more we are able to hook before any fall off.

Align Marketing to educational taste and interest
These customers are more likely to have higher education so we should explore ways to appeal to this type of consumer in our marketing language.
Further Research Suggestion and Reflection
These findings provide a strong foundation for a preliminary user story. However, if this were a real user research effort, I would validate these insights with customers to ensure the findings and recommendations align with their actual mental models, shopping behaviors, and unmet needs.
Potential next steps include:
Conduct additional market and user research to validate trends and identify products that better align with:
The needs of families with children and teens
Differences across education levels
Seasonal purchasing behaviors
Design targeted marketing campaigns based on the customer segments identified in this analysis and validate their effectiveness through A/B testing with representative users.